“How many hours did each team record?” and “How did each team’s hours change between January and February?” sound similar, but they ask for different shapes of answer. The first needs one total per team. The second needs a team-by-month comparison. Choosing the output shape before clicking a tool makes the result easier to interpret.
A grouped summary and a pivot table can start with the same ledger. Neither changes the meaning of the underlying measure automatically. Their usefulness depends on which categories you group, which calculation you apply and what you believe an empty combination represents.
Start with four records you can total by hand
Use this small example as a working ledger. Every row records hours for one team in one month. The two Design entries in January are separate records, not an accidental duplicate of an entire line.
Team,Month,Hours
Design,Jan,3
Design,Jan,2
Design,Feb,5
Build,Jan,4
The total is fourteen hours. Design contributes ten and Build contributes four. January contributes nine and February contributes five. Write those four facts down before producing either summary. They are independent expectations against which to check the output, rather than conclusions copied from whichever table the software displays.
One grouping field answers a compact question
The pandas group-by documentation describes splitting records into groups and applying calculations such as sums, means and counts. In an everyday report, a grouped table is often the clearest response when one category is the primary question and another dimension would only add clutter.
Open CSV group summary. Paste the ledger, group by Team and select Hours as the numeric column. Sum should return Design with ten and Build with four. Count answers a different question: Design has three records and Build has one. It does not tell you there are three people in Design unless each source row actually represents one distinct person.
Average also needs a defined unit. Design’s average is ten divided by three records, approximately 3.333 hours per record. It is not automatically hours per employee, per day or per month. A correct arithmetic result can still be misleading if the label suggests a denominator the data does not contain.
A pivot exposes a second dimension
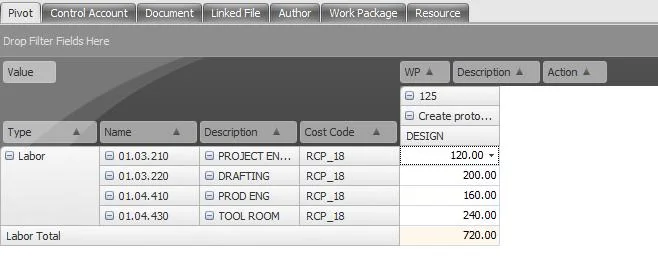
The pandas guide to reshaping and pivot tables discusses arranging categories across axes. In CSV pivot table, choose Team for rows, Month for columns and Hours for values. This local tool sums the values for each combination. It does not offer every aggregation supported by a full analysis library.
The Design row should show five for January and five for February. Build should show four for January and zero for February. The repeated Design-January records are combined into one cell. This is useful when you want to compare categories side by side without scanning all the original records.
Read the exported headers rather than assuming their exact wording. Handyfold prefixes value-column labels with sum: to make the operation explicit and avoid collisions. The arrangement is still a summary; it does not preserve a separate row for every original observation.
What does that zero actually establish?
There is no Build-February record in the example. Handyfold fills that combination with zero. In the output’s arithmetic, that is the contribution of the available records. It is not evidence that someone confirmed Build did no work during February. Perhaps there was no activity, or perhaps the export is incomplete.
Resolve that distinction using the business process that produced the ledger. A complete reporting system might define an absent combination as zero activity. An unfinished timesheet collection might require a missing-data warning. The pivot cannot infer which situation applies from an absent row alone.
If the distinction matters, document it alongside the table or prepare a separate completeness check. Do not overwrite unknown values with comforting zeros in the source merely to make the chart look finished. The presentation should not make a stronger claim than the evidence supports.
Reconcile before drawing a chart
Add the pivot cells: five plus five plus four plus zero equals fourteen. Add each row and compare with the grouped team totals. Add each month’s column and compare with the hand totals. This cross-check detects a wrong field choice or an unexpected source omission before the result becomes a polished chart.
Keep units consistent as well. A column mixing hours and minutes cannot be meaningfully summed merely because all cells are numeric. A value containing explanatory text should be resolved before running the calculation. The local tool rejects non-finite numeric input rather than guessing how to interpret it.
Use the grouped table when you need a short answer to one categorical question. Use the pivot when the relationship between two categories is part of the question. Preserve the ledger behind both, and label the calculation and missing-data assumptions. The best summary is the smallest table that answers the intended question without concealing how its numbers were obtained.